
Kafka Sensor City Demo
A fully orchestrated event streaming pipeline running on your laptop. Simulates hundreds of road sensors across a fictional city, filters and aggregates the stream, and displays live traffic state on a web dashboard.
Built to demonstrate why Kafka exists and how it differs from a message queue like RabbitMQ — through working code you can actually run.
What’s running
| Service | Language | Role |
|---|---|---|
sensor-simulator | C# | Produces fake sensor events to raw-sensor-events |
filter-service | C# | Drops non-intersection events, forwards the rest |
aggregator-service | C# | Maintains rolling 30s windows, publishes state changes |
dashboard-service | C# / ASP.NET Core | Consumes state changes, pushes to browser via SignalR |
Prerequisites
Install these before you begin:
- Docker Desktop — for building images
- minikube — local Kubernetes cluster
- kubectl — Kubernetes CLI
- Helm — not required by this demo but useful to have
- .NET 10 SDK — to build the C# services
On a Mac with Homebrew:
brew install minikube kubectl
brew install --cask docker
Download the .NET 10 SDK from dot.net.
Project structure
.
├── k8s/
│   ├── kafka/
│   │   └── kafka.yaml               # Kafka StatefulSet + Service + ConfigMap
│   ├── sensor-simulator.yaml
│   ├── filter-service.yaml
│   ├── aggregator-service.yaml
│   └── dashboard-service.yaml
├── SensorSimulator/
│   ├── Program.cs
│   ├── SensorEvent.cs
│   ├── CitySimulator.cs
│   └── Dockerfile
├── FilterService/
│   ├── Program.cs
│   └── Dockerfile
├── AggregatorService/
│   ├── Program.cs
│   ├── SignalState.cs
│   └── Dockerfile
└── DashboardService/
    ├── Program.cs
    ├── TrafficHub.cs
    ├── IntersectionStateStore.cs
    ├── wwwroot/
    │   └── index.html
    └── Dockerfile
Getting started
1. Start minikube
minikube start
kubectl get nodes
You should see one node with STATUS = Ready.
2. Deploy Kafka
kubectl apply -f k8s/kafka/kafka.yaml
kubectl get pods -n kafka --watch
Wait for kafka-0 to show 1/1 Running. Then create the three topics:
kubectl exec -it kafka-client -n kafka -- /bin/bashInside the pod:
export PATH=$PATH:/opt/kafka/bin

kafka-topics.sh --bootstrap-server kafka:9092 --create --topic raw-sensor-events --partitions 6 --replication-factor 1
kafka-topics.sh --bootstrap-server kafka:9092 --create --topic intersection-events --partitions 4 --replication-factor 1
kafka-topics.sh --bootstrap-server kafka:9092 --create --topic signal-state-changes --partitions 4 --replication-factor 1

kafka-topics.sh --bootstrap-server kafka:9092 --list
Exit the pod with exit.
3. Point Docker at minikube
This is required before every build so images land inside minikube rather than your Mac’s local Docker:
eval $(minikube docker-env)4. Build and deploy all services
Run each block in order:
# Sensor simulator
cd SensorSimulator
docker build -t sensor-simulator:latest .
cd ..
kubectl apply -f k8s/sensor-simulator.yaml

# Filter service
cd FilterService
docker build -t filter-service:latest .
cd ..
kubectl apply -f k8s/filter-service.yaml

# Aggregator service
cd AggregatorService
docker build -t aggregator-service:latest .
cd ..
kubectl apply -f k8s/aggregator-service.yaml

# Dashboard service
cd DashboardService
docker build -t dashboard-service:latest .
cd ..
kubectl apply -f k8s/dashboard-service.yaml
Check everything is running:
kubectl get pods -n kafkaYou should see five pods all showing 1/1 Running:
NAME                                 READY   STATUS    RESTARTS
aggregator-service-xxx               1/1     Running   0
dashboard-service-xxx                1/1     Running   0
filter-service-xxx                   1/1     Running   0
kafka-0                              1/1     Running   0
sensor-simulator-xxx                 1/1     Running   0
5. Open the dashboard
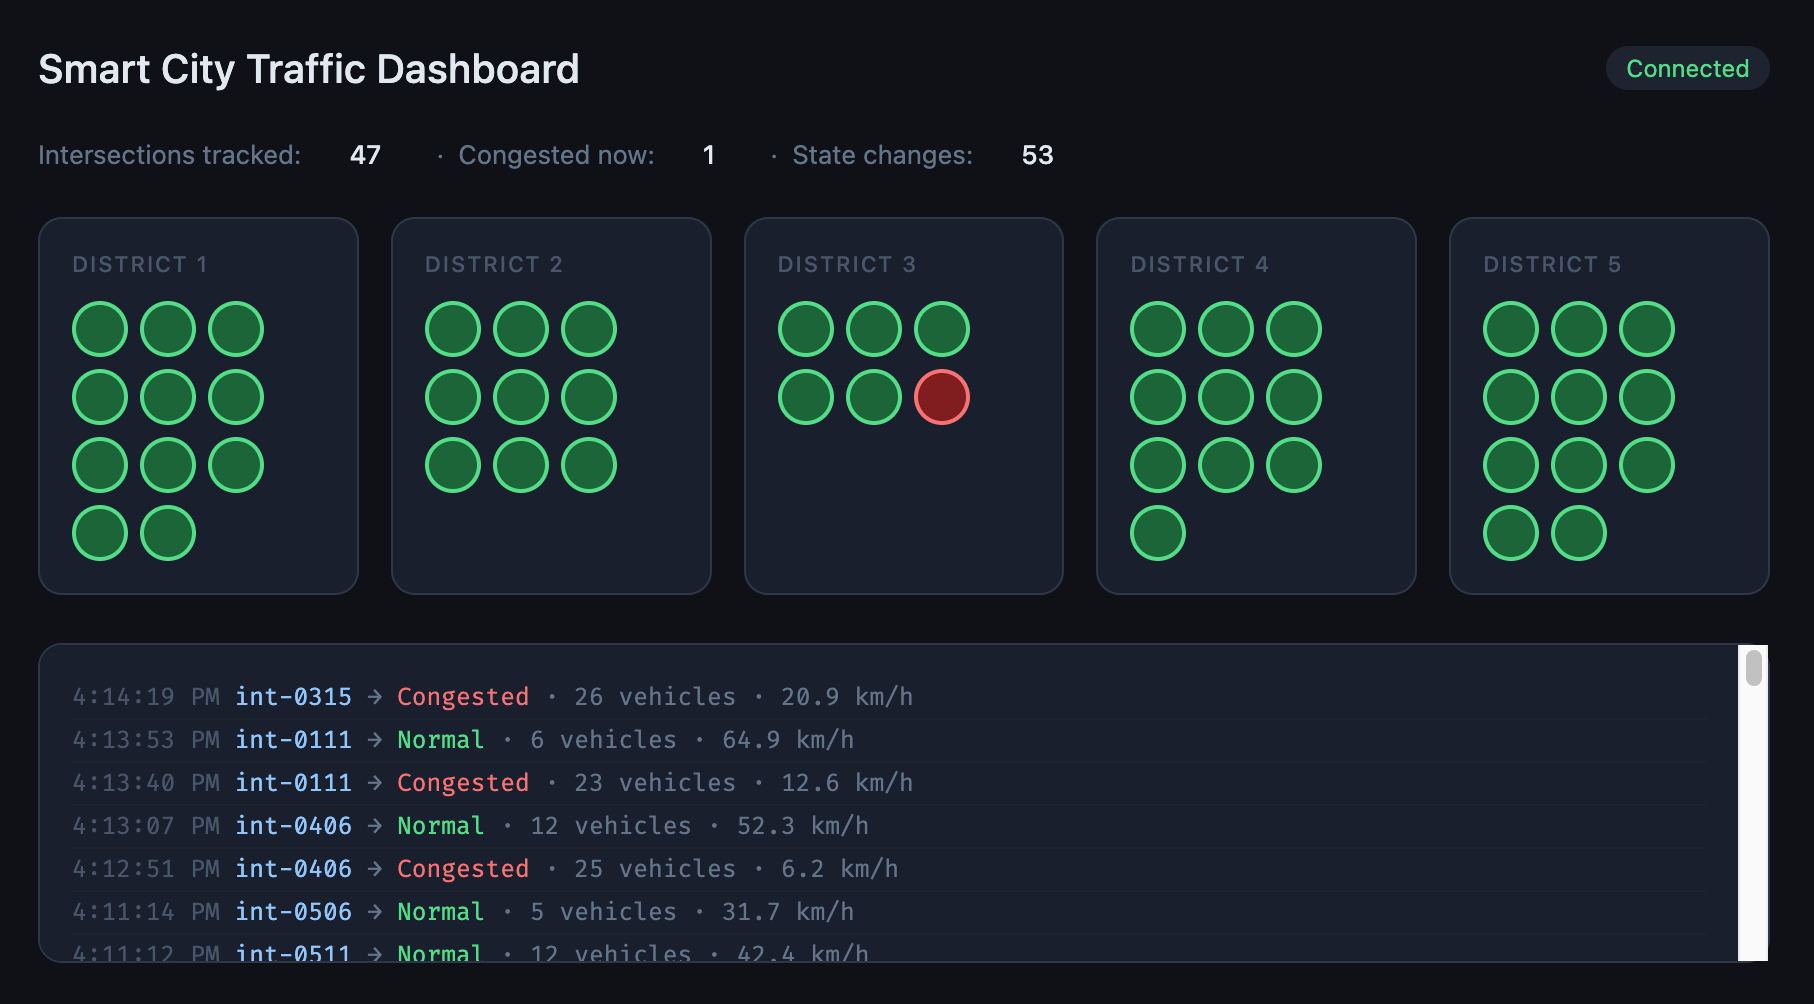
minikube service dashboard-service -n kafkaYour browser will open automatically. You should see the city map appear within a few seconds as intersections are discovered from the event stream.
The demo moment — replaying events
This is the clearest way to see what makes Kafka different from RabbitMQ.
While the pipeline is running, scale the dashboard down to zero:
kubectl scale deployment/dashboard-service -n kafka --replicas=0Wait 30 seconds — state changes are piling up in signal-state-changes unread.
Now bring it back:
kubectl scale deployment/dashboard-service -n kafka --replicas=1
minikube service dashboard-service -n kafka
The dashboard replays every missed state change and catches up to the present. In RabbitMQ, those messages would have been lost the moment the consumer disconnected.
Watching the pipeline
Follow logs for each service in separate terminals:
# What the simulator is producing
kubectl logs -n kafka deployment/sensor-simulator --follow

# Filter pass/drop rates
kubectl logs -n kafka deployment/filter-service --follow

# State changes being published
kubectl logs -n kafka deployment/aggregator-service --follow

# What the dashboard is broadcasting
kubectl logs -n kafka deployment/dashboard-service --follow
Key Kafka concepts demonstrated
| Concept | Where you see it |
|---|---|
| Topics as durable logs | Restarting a consumer replays missed events |
| Consumer groups | Four independent services reading the same broker |
| Partition keys | districtId ensures ordered delivery per district |
| Offset tracking | Each service picks up exactly where it left off |
| Event-time vs processing-time | timestampUtc from the sensor, not the broker |
| State transitions | Aggregator publishes changes, not raw readings |
Teardown
minikube deleteThis removes the entire VM, cluster, and all data.
Why not RabbitMQ?
RabbitMQ is a message broker — it delivers messages from A to B and deletes them once consumed. It is excellent for job queues, RPC patterns, and transient notifications.
Kafka is an event log — it appends events durably and lets any number of consumers read them independently, at their own pace, from any point in history. It is the right choice when you need replay, fan-out to independent consumers, or long-term event retention.
This demo uses Kafka because the dashboard, the aggregator, and a hypothetical ML model can all consume the same raw sensor stream without any of them knowing the others exist. Add a new consumer tomorrow and it can read six months of history. That is not possible with RabbitMQ.